


HONOR AWARD
PGHSNAP: Neighborhood Data and Map Resource
Pittsburgh USA
City of Pittsburgh, PA Department of City Planning, Pittsburgh USA
 Close Me!
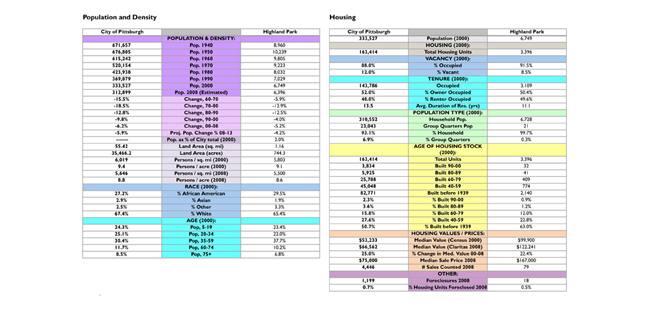
Example page from the Asset Profiles component showing layout of data tables. Note that each neighborhood is always compared directly to the city of Pittsburgh as a whole. Highland Park is in Pittsburgh’s Sector 12: Upper East End.
Download Hi-Res ImagePhoto: Justin Miller, Darin Palilla
Photo 1 of 15
 Close Me!
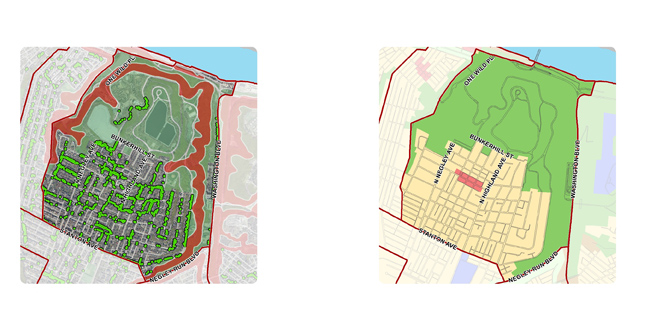
From Asset Profiles — each map’s colors correspond to the coded table below it.
Download Hi-Res ImagePhoto: Justin Miller, Darin Palilla
Photo 2 of 15
 Close Me!
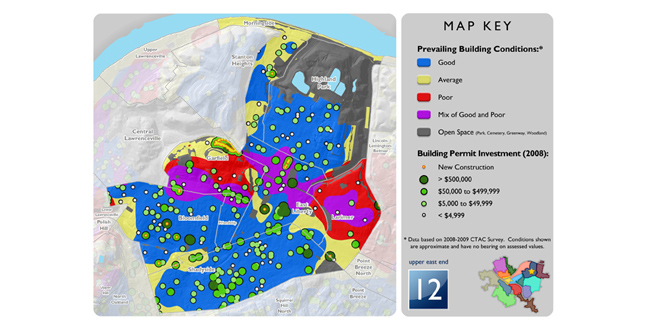
From Asset Profiles — this example map is from a series that shows prevailing building conditions overlaid with building permit data. For example, we can infer from the purple areas that conditions may be improving due to increased investment.
Download Hi-Res ImagePhoto: Justin Miller, Darin Palilla
Photo 3 of 15
 Close Me!
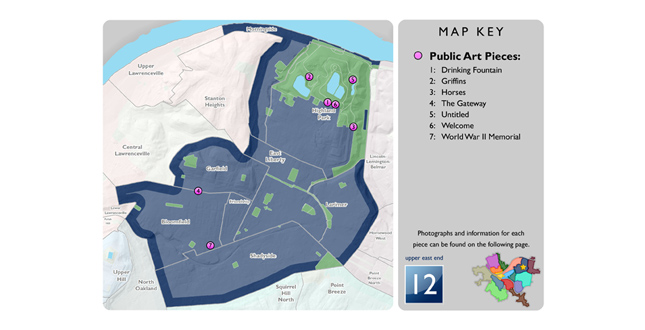
From Asset Profiles—This map shows the location of city-owned public art pieces. Its companion page follows.
Download Hi-Res ImagePhoto: Justin Miller, Darin Palilla
Photo 4 of 15
 Close Me!
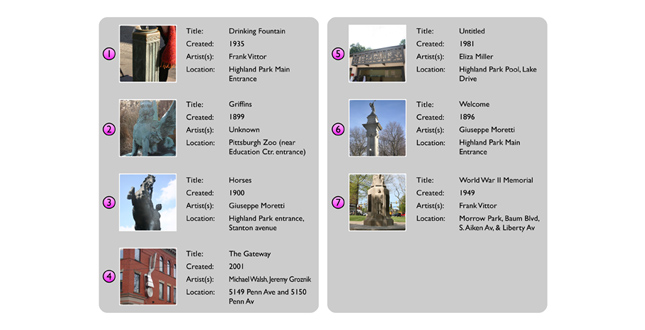
This example page further illustrates the city’s pubic art collection, showing thumbnail images and other pertinent information about each piece.
Download Hi-Res ImagePhoto: Justin Miller, Darin Palilla
Photo 5 of 15
 Close Me!
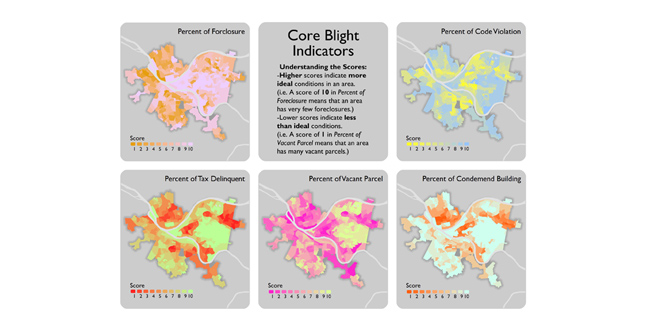
From Action Planning—this first set of maps shows the indicators that are used to formulate the analysis. Further information on how each data set is incorporated into the study follows.
Download Hi-Res ImagePhoto: Justin Miller, Darin Palilla
Photo 6 of 15
 Close Me!
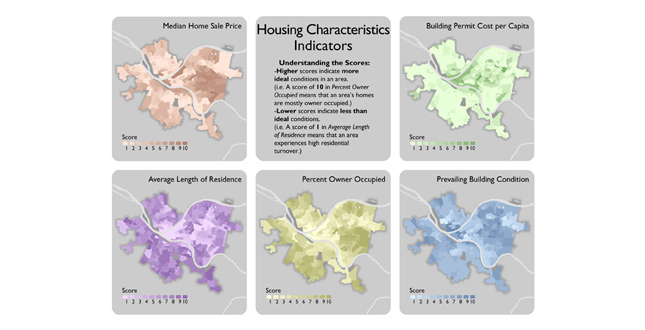
From Action Planning—this series of data sets represents the physical conditions in each neighborhood.
Download Hi-Res ImagePhoto: Justin Miller, Darin Palilla
Photo 7 of 15
 Close Me!
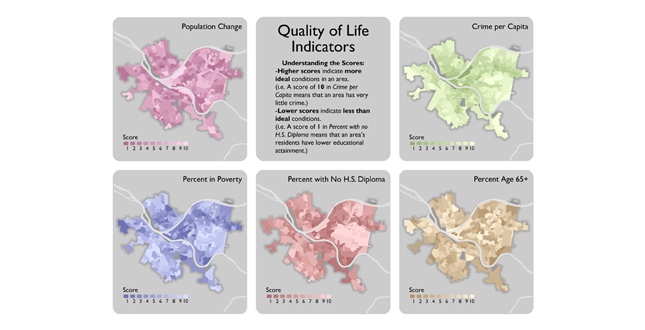
From Action Planning—this series of data sets represents the social conditions in each neighborhood.
Download Hi-Res ImagePhoto: Justin Miller, Darin Palilla
Photo 8 of 15
 Close Me!
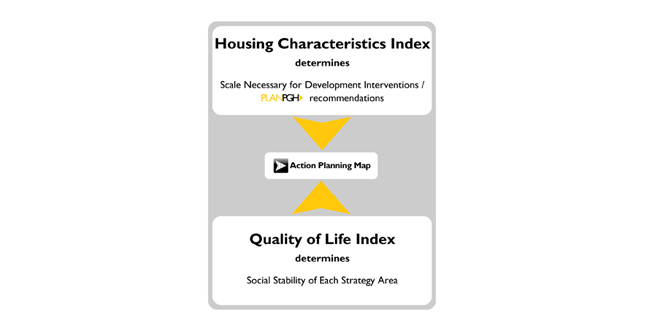
Each portion of the Action Planning analysis is shown here. The HCI represents the physical, and the QLI represents the social. The process for formulating the analysis is shown on the following page.
Download Hi-Res ImagePhoto: Justin Miller, Darin Palilla
Photo 9 of 15
 Close Me!
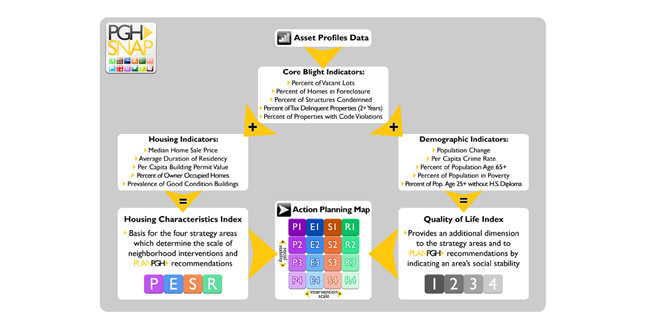
Here we see the process for incorporating the blight indicators with the physical and social indicators to form a complete analysis. The result is the matrix at the bottom/center. A close-up of the matrix follows on the next page.
Download Hi-Res ImagePhoto: Justin Miller, Darin Palilla
Photo 10 of 15
 Close Me!
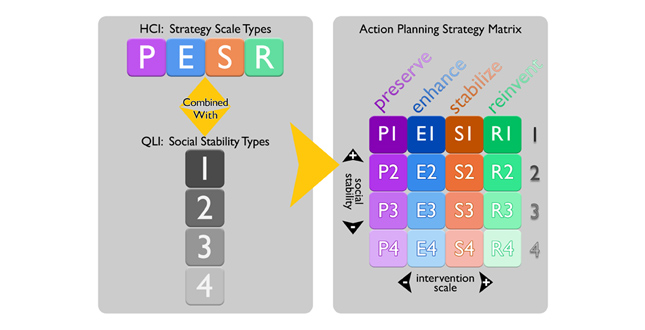
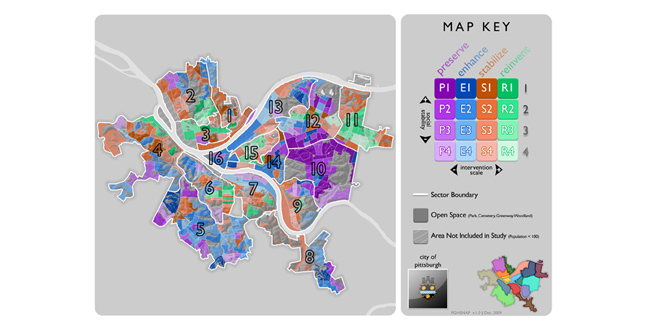
The matrix shows the scale at which community development interventions should take place, coupled with the area’s social stability. These areas are mapped in images 13 and 14.
Download Hi-Res ImagePhoto: Justin Miller, Darin Palilla
Photo 11 of 15
 Close Me!
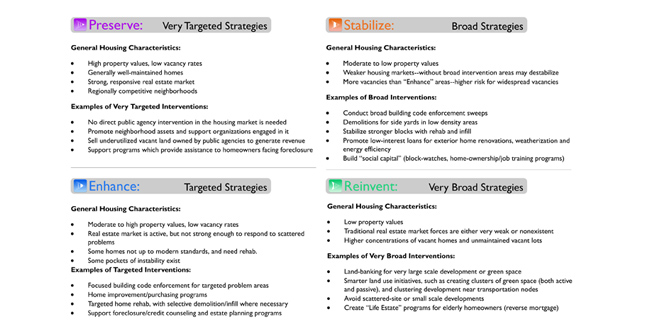
Neighborhood typologies drawn from the Housing Conditions index from Action Planning. Each recommends an intervention scale and corresponding strategies based on the analysis of housing-specific indicators. Action steps will be refined by the Comprehensive Plan process.
Download Hi-Res ImagePhoto: Justin Miller, Darin Palilla
Photo 12 of 15
 Close Me!
This is the citywide Action Planning map. The matrix serves as the map key, and allows the user to gauge the relative physical and social conditions of an area, and the scalesat which successful interventions will happen.
Download Hi-Res ImagePhoto: Justin Miller, Darin Palilla
Photo 13 of 15
 Close Me!
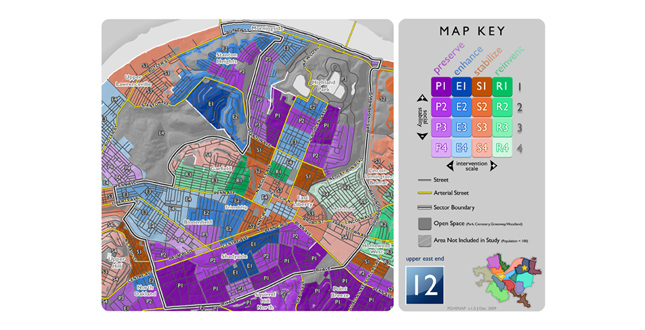
This is a close-up of one planning sector’s Action Planning map. Here, each strategy area (E1, P3, etc.) can be seen labeled. This is useful for tracking an area’s progress over time.
Download Hi-Res ImagePhoto: Justin Miller, Darin Palilla
Photo 14 of 15
 Close Me!
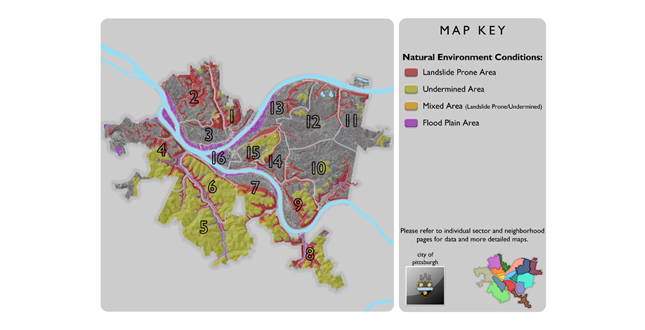
Citywide map showing natural environment conditions. This presents a quick look at the challenges designers face in development projects in Pittsburgh given its topography, hydrology, and industrial history. PGHSNAP allows users to conduct macro to micro-scale scans of project areas.
Download Hi-Res ImagePhoto: Justin Miller, Darin Palilla
Photo 15 of 15
Project Statement
PGHSNAP is a comprehensive data resource for the city of Pittsburgh, incorporating up-to-date information that makes planning and design projects more efficient and inclusive. PGHSNAP makes information open and accessible, and sets the framework for "PLANPGH," the city's first Comprehensive Plan. This project is award-worthy because it provides a valuable data resource to the public—making planning more transparent and creating a level data playing field for all stakeholders involved in community development and design.
Project Narrative
—2010 Professional Awards Jury
PGHSNAP was developed to help in the assessment of conditions in the city of Pittsburgh's 90 neighborhoods. It is an interactive online data and map center that provides timely and accessible data for design professionals, investors, community organizations, residents, advocacy organizations, etc. PGHSNAP solves the main problem that designers, development professionals, and the general public share when trying to access information about their neighborhoods—data is available, but often at differing geographies, units of analysis, and quality. PGHSNAP takes these data sources and aggregates them to neighborhood units that people in Pittsburgh understand and recognize, and organizes them geographically and thematically.
Free and uncomplicated access to critical data is central to PGHSNAP—it helps to assure that members of the public are able to find the information they need, and that professionals can make informed decisions and deliver quality materials to their clients.
PGHSNAP provides neighborhood stakeholders with the tools they need to strategize their investments and other community improvement activities. PGHSNAP helps designers and consultants to determine neighborhood context and needs, and helps them clearly articulate existing conditions, problems and potential solutions to their clients. Comprehensive, current data provides a firm foundation for making sound and feasible design and planning recommendations. PGHSNAP provides a spectrum of data analysis from the parcel level to neighborhood level, to city sectors (strategic groups of neighborhoods) to citywide data. This can save time and money for professionals—costly aggregation and cleaning of data can be avoided, and tracking down multiple data sources is eliminated. Project managers can spend more time on the actual project, rather than hunting for data.
PGHSNAP is comprised of two components that work together as a web-based application: PGHSNAP is an acronym that is derived from these components: Pittsburgh Sector/Neighborhood Asset Profiles and Action Planning.
- Sector/Neighborhood Asset Profiles—this component is
designed to be a snapshot of each neighborhood in the City of Pittsburgh,
and includes information such as demographic data, existing physical conditions,
transportation, and other amenities. This component features hundreds of
maps to accompany nearly 1,000 tables. PGHSNAP data is drawn from
the U.S. Census Bureau, Geographic Information Systems (GIS), and a variety
of city/county departments and agencies.
- Sector/Neighborhood Action Planning—this component is
intended to take the baseline data a step further. Data is aggregated and
analyzed, resulting in
four neighborhood typologies that address the physical conditions of the
housing stock in each neighborhood, combined with four typologies that address
the
social conditions of each neighborhood. Accompanying the typologies is a
general "strategy manual" to
assist neighborhood stakeholders, designers and investors in decision-making
processes. The project team developed two neighborhood indicator sets that
form the basis for PGHSNAP: the Housing Conditions Index (HCI) and Quality
of Life
Index (QLI).
- The HCI consists of data relevant to housing conditions and trends (physical condition context).
- The QLI consists of social/demographic conditions and trends. (social context). Together, they form the basis for an Action Planning strategy map and corresponding action items. A flowchart of the Action Planning data sets can be found in image 639-10, and further examples of the strategy typologies can be found in image 639-12.
The PGHSNAP project was created with user-friendly graphic design in mind. Each section of the project is color-coded to match geographic locations in the city, and all data sets within each section are organized thematically. Graphics, maps, and tables are all contemporary in their design, presenting a "friendly" face to what would otherwise be presented in dry, uninspiring tabular form.
PGHSNAP is currently active and available online. Users include design professionals, investors, community groups, government agencies, current and future residents, and universities. Design and planning consultants have applauded PGHSNAP for providing up-to-the-minute information upon which they can base project proposals and budget estimates. The Asset Profiles component is already serving as a valuable information resource for the public, and the Action Planning component has been used in applications for developing grant proposals at Pittsburgh's Urban Redevelopment Authority. It serves as the data platform for the upcoming Comprehensive Plan, saving consultant teams valuable time and considerable effort to "clean" data and assess baseline conditions. Once plan recommendations begin to emerge from the planning process, they will be entered into PGHSNAP, further refining the Action Planning maps and strategies.
Outreach was a critical component of making PGHSNAP a success. For the nearly two years it was in development, PGHSNAP was vetted with a number of community, foundation, and government partners. Prior to the public launch of the PGHSNAP tool on February 1, 2010, the project team held open house format information sessions attended by eighty key partners of the city. The project team also held focus groups and a two-day hands-on product testing and training session attended by a broad cross section of city stakeholders to assure that PGHSNAP met their data and mapping needs, and was easy to use. These sessions proved to be extremely valuable, allowing the project team to build a buzz about the public launch and assure a high-quality bug-free product. The response from our users has been overwhelmingly positive. Since the public launch of SNAP, over 4,000 users have logged into the site, with 900 doing so on the first day. The launch was covered by a wide variety of media outlets. Future outreach will include in-depth information sessions with community groups citywide, presentations to university students and faculty, and professional conferences.
PGHSNAP is intended to inform and complement ongoing community planning. It will serve as a foundation for future planning and design at all scales, from the parcel level to the neighborhood scale to "PLANPGH," the citywide Comprehensive Plan. It can only perform these functions if it is current. It is administered in such a way that it will be continually updated to reflect the most current data available. It will receive a major update yearly, and several minor updates throughout the year. There is a subscription service on the project website that allows users to be notified when updates are available.
The project may be viewed online at www.pghsnap.com.
Project Resources
City of Pittsburgh, Department of City Planning
Noor Ismail, Director of City Planning
Joy Wright Abbott, ASLA, Assistant Director, Development and Design
Michael Homa, GIS Manager
Darin Palilla, GIS Analyst
Justin Miller, Neighborhood Planner
David White, GIS Analyst
Glen Claughton, LAN Administrator
Rebecca Reinhold, GIS Analyst
Richard Meritzer, Intern Coordinator
DCP Interns:
Tom Converso, Joseph Hollinger, Carolyn Mazzella, Katie McAuley, Haley Miller, Adam Nelson, J.R. Poole, Matt Stidle, Iris Whitworth, Heather Zanoni, Dillon Zeiler, Vanessa Alberts, Keith Dougall