


Honor Award
Getting to Minus 80: Defining the Contribution of Urban Form to Achieving Greenhouse Gas Emission Reduction Targets
The Design Centre for Sustainability at The University of British Columbia, Vancouver, Canada
Client: City of Calgary, The City of North Vancouver, Christenson Development Ltd.
 Close Me!
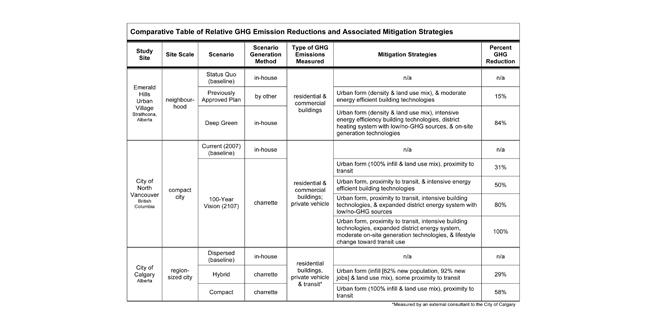
Comparative Table of Relative GHG Emission Reductions and Associated Mitigation Strategies
Download Hi-Res ImagePhoto: UBC Design Centre for Sustainability
Photo 1 of 14
 Close Me!
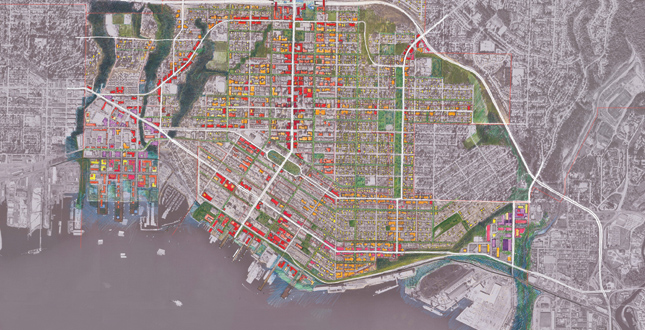
City of North Vancouver 100-Year Vision: achieves up to 100 percent GHG emission reduction through urban form, proximity to transit, intensive energy-efficient building technologies, an expanded district energy system, moderate on-site energy generation, and increased transit use.
Download Hi-Res ImagePhoto: UBC Design Centre for Sustainability
Photo 2 of 14
 Close Me!
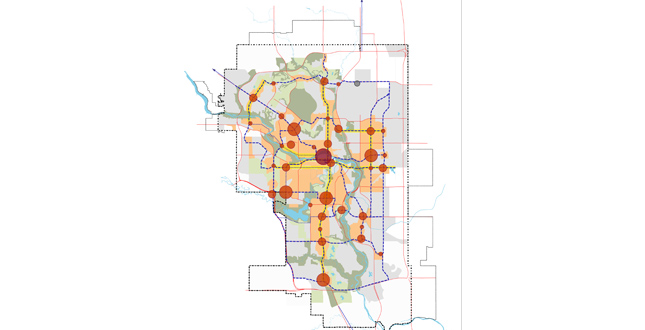
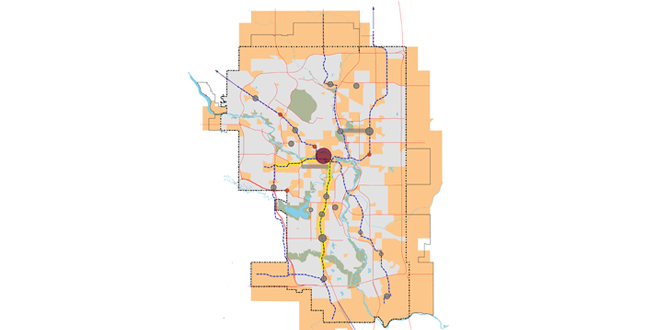
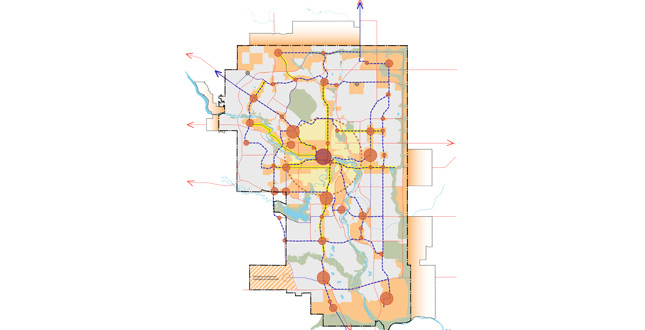
City of Calgary Compact Scenario: achieves a 58 percent reduction in GHG emissions by locating 100 percent of new population and job growth (through 2075) within the existing urban footprint. Redevelopment is directed to greyfield areas within walking distance of transit.
Download Hi-Res ImagePhoto: UBC Design Centre for Sustainability
Photo 3 of 14
 Close Me!
City of Calgary Dispersed Scenario: provides the GHG emissions baseline. The scenario is based on current development trends and existing city policy, and assumes the majority of hew housing well located on the urban fringes, with modest redevelopment near transit.
Download Hi-Res ImagePhoto: UBC Design Centre for Sustainability
Photo 4 of 14
 Close Me!s
City of Calgary Hybrid Scenario: achieves a 29 percent reduction in GHG emissions by locating 62 percent of new population and 92 percent of new jobs (through 2075) within the existing urban footprint. Redevelopment is directed to greyfield areas within walking distance of transit.
Download Hi-Res ImagePhoto: UBC Design Centre for Sustainability
Photo 5 of 14
 Close Me!
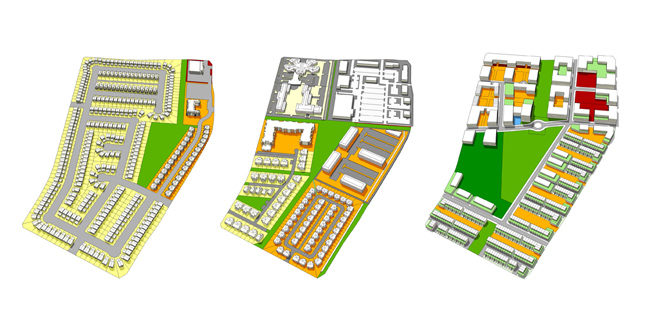
Emerald Hills Urban Village Scenarios: achieve a 15 percent reduction in GHG emissions for the Previously Approved Plan scenario (center), and an 84 percent reduction for the Deep Green scenario (right), as compared to the Status Quo (baseline) scenario (left).
Download Hi-Res ImagePhoto: UBC Design Centre for Sustainability
Photo 6 of 14
 Close Me!
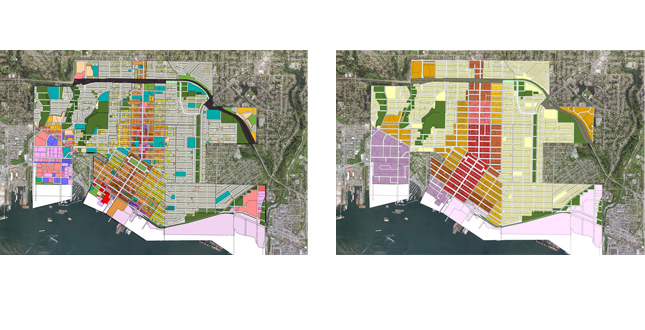
City of North Vancouver Spatial Mapping/Analysis Diagrams: illustrate how study sites were first mapped by case (left), then assembled into development patterns (right), each representing a particular mix and proportion of land uses, configuration of streets, and population and job density.
Download Hi-Res ImagePhoto: UBC Design Centre for Sustainability
Photo 7 of 14
 Close Me!
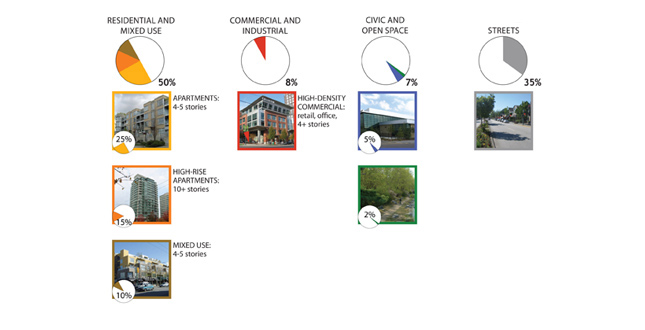
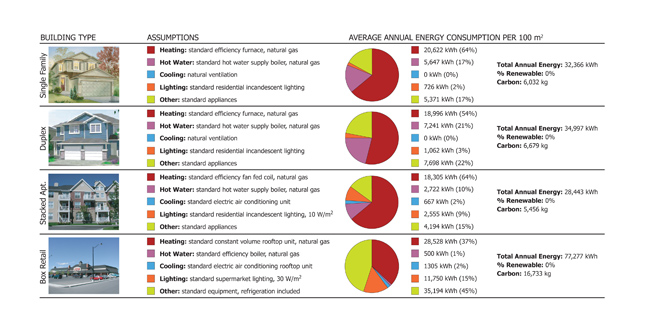
Breakdown of a Development Pattern: illustrates the types of data included in the development patterns. These patterns were used as inputs to the building energy and transportation demand models to calculate GHG emission reductions.
Download Hi-Res ImagePhoto: UBC Design Centre for Sustainability
Photo 8 of 14
 Close Me!
Emerald Hills Building Energy Profiles: quantitative descriptions of energy consumption by end use and energy source for each building type were used to model the energy demand in the Emerald Hills and North Vancouver scenarios.
Download Hi-Res ImagePhoto: UBC Design Centre for Sustainability
Photo 9 of 14
 Close Me!
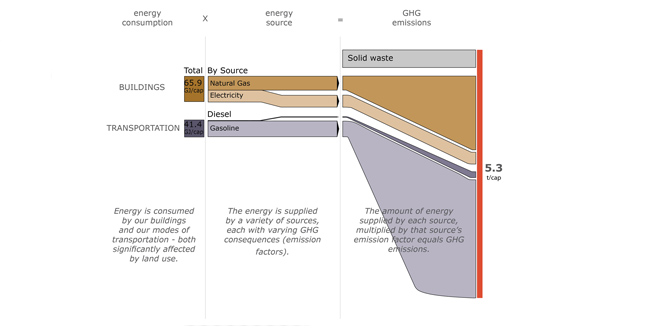
City of North Vancouver Sanke Diagram for the Current (2007) Scenario (baseline): illustrating the modeled results of energy consumption, source and resulting GHG emissions for buildings and transportation. The 100 Year Vision was assessed against this emission baseline.
Download Hi-Res ImagePhoto: UBC Design Centre for Sustainability
Photo 10 of 14
 Close Me!
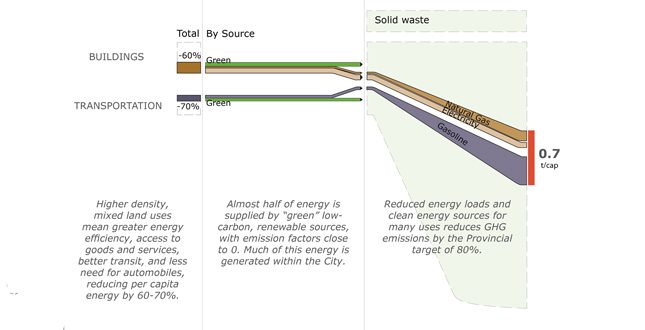
City of North Vancouver Sanke Diagram for the 100 Year Vision Scenario (2050): illustrating modeled scenario results for the year 2050, and how it achieves an 80 percent reduction in GHG emissions, the city’s target in compliance with provincial legislation.
Download Hi-Res ImagePhoto: UBC Design Centre for Sustainability
Photo 11 of 14
 Close Me!
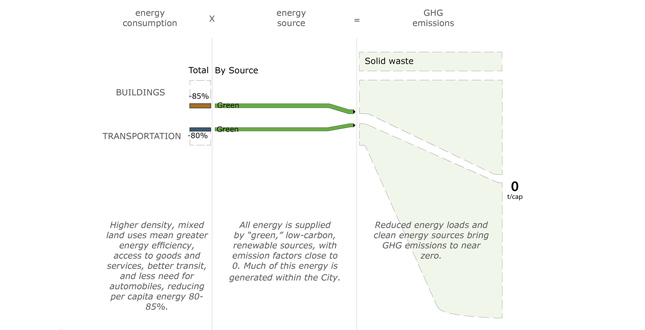
City of North Vancouver Sanke Diagram for the 100 Year Vision Scenario (2107): illustrating modeled scenario results for the year 2107, and how it achieves a 100 percent reduction in GHG emissions, the city’s ultimate target.
Download Hi-Res ImagePhoto: UBC Design Centre for Sustainability
Photo 12 of 14
 Close Me!
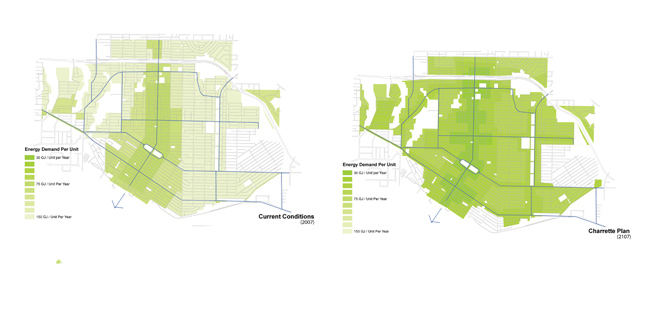
City of North Vancouver GHG Emission Maps: illustrating GIS modeling results, demonstrate that the vision achieves GHG 100 percent emission reductions (right), as compared to current conditions (left). (Darker green indicates lower and lighter green indicates higher GHG emissions.)
Download Hi-Res ImagePhoto: UBC Design Centre for Sustainability
Photo 13 of 14
 Close Me!
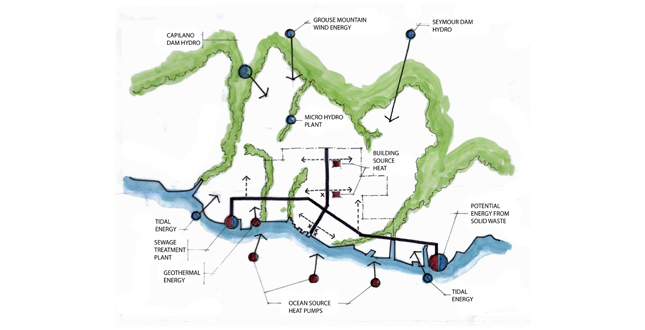
City of North Vancouver Renewable Energy Sources Diagram: illustrates the potential “green” energy sources key to achieving the 100 percent GHG emission reduction. Sources would fuel the expanded district energy system, serving all multifamily, commercial, industrial and institutional buildings.
Download Hi-Res ImagePhoto: UBC Design Centre for Sustainability
Photo 14 of 14
Project Statement
Professionals working with local governments on the planning and design of communities are increasingly being required to know which urban form strategies will successfully achieve GHG emission reduction targets set by state and provincial legislation. This innovative research closely evaluates and describes in detail the combinations of urban form strategies that landscape architecture professionals can promote and implement to achieve up to an 80 to 84 percent reduction in relative GHG emissions, and beyond.
Project Narrative
—2010 Professional Awards Jury
Introduction
Globally, the causes and impacts of climate change now have mass consensus. The 2007 Intergovernmental Panel on Climate Change synthesis report offers the strongest evidence to date on human contributions to greenhouse gases (GHGs) in the atmosphere, stating that anthropogenic impacts over the last 30 years have raised average global temperatures, influenced extreme weather events and altered many physical and biological systems. Minimizing the negative effects of climate change is now believed to require between 50 percent and 85 percent reductions in GHG emissions from 2000 levels by 2050.
Within states and provinces in the United States and Canada, GHG emission reduction challenges are being addressed by new legislation that set targets for reductions within a comparatively short period. For example, the British Columbia Greenhouse Gas Reduction Targets Act (GRTA) (2007) requires municipalities to reduce GHG emissions 33 percent below 2007 levels by 2020, and 80 percent below by 2050. This means local governments are playing an increasingly important role in achieving GHG reduction targets.
Community GHG Emissions and Urban Form
Local governments generally have little control over certain aspects contributing to community-level GHG emissions, such as technological innovations, energy utilities, regionally negotiated transportation decisions, and provincially controlled building codes. Much of their control lies in the arena of decisions on urban form, i.e. land use and infrastructure planning and associated policies. As recognized in numerous studies, the link between urban form, building and transportation energy consumption and GHG emissions is strong.
Among the characteristics of urban form that influence building and transportation energy consumption and GHG emissions, density has the greatest impact. For buildings, density results in efficiencies in space heating and could reduce average household density by as much as 20 percent. For transportation, compact development, a high diversity of land uses, and transit-oriented development principles result in reduced vehicle ownership and an increased proportion of travel by walking, cycling and transit, and could reduce vehicle kilometers traveled and GHG emissions by 20 to 40 percent. This means a 40 to 60 percent reduction in GHG emissions could be possible through urban form choices alone. Other characteristics of urban form that impact building and transportation energy demand and emissions include: urban geometry, or the shape, arrangement and orientation of buildings in the landscape, which affect the availability of daylight, solar energy and the potential for natural ventilation to reduce building energy consumption; and pedestrian-friendly design, including street connectivity, building orientation and design and landscape features that contribute to relative pedestrian comfort, which can also increase the proportion of nonvehicular transit.
Despite increasing knowledge on the relationship between urban form and GHG emissions, there remains a significant gap between planning intentions and development occurring on the ground. At the regional and community level, local governments are challenged by GHG emission reduction legislation to understand the implications of these targets for land use and transportation planning decisions. A key part of this challenge is the gap between the climate change science that generally connects urban form to GHG emissions, and understanding the best combination of alternative land use and transportation strategies to achieve reduction targets. For example, British Columbia, municipalities challenged with implementing the GRTA, which requires municipalities to reduce annual community GHG emissions 80% from 2007 levels by 2050, must achieve a 20-40% greater reduction than the 40-60% estimated to be achievable through urban form. Professionals working with local governments on the planning and design of communities need to know: Is there a combination of design-based choices that together can result in GHG emission reductions to meet legislated targets?
Areas of Inquiry
Our research responds to this challenge by estimating and visualizing the relative GHG emission reduction contributions of urban form, building design, and energy systems choices within collaborative, municipal planning processes. To establish findings that will be applicable to a broad range of communities, research was conducted under different scales and contexts using three sites: the city of Calgary, Alberta, a regional-scale community; the city of North Vancouver, British Columbia, a geographically contained, compact city; and, the Emerald Hills Urban Village, a new 20-hectare (50-acre) neighborhood proposed in Strathcona County, Alberta. For the purposes of this study, we used the GRTA targets of 33 pecent below 2007 emission levels by 2020, and 80 percent below by 2050.
Method of Inquiry
This research incorporated three phases: creating a case-study-based tool for directly linking physical community planning and design choices to resulting GHG emissions; applying this tool in the generation of alternative development scenarios in collaborative municipal planning processes specifically exploring urban form, building design and energy system choices; and, further applying this tool in the measurement of GHG emissions potentially resulting under the alternative scenarios.
Phase 1—Case-Based Development Pattern Method
Primarily, this method involves the application of individual "cases" and/or "development patterns" across the study site, either manually or using a GIS application, depending on study site scale. Development patterns are discrete, replicable units of urban fabric that can be used to spatially "sketch" or approximate a neighborhood, city or region according to existing conditions or future assumptions. Each development pattern represents a shared set of urban form characteristics including land use mix, development density, street pattern, housing type, building geometry, commercial and residential floor area, and block and parcel configuration. Development patterns are "packages" of urban form decisions that can facilitate the rapid generation of planning scenarios, enable various types of performance analysis, and translate into municipal policy decisions.
Development patterns were constructed from a comprehensive collection of parcel-scale land use "cases"—case studies representing both built and archetypal examples of streets, open spaces and buildings across a range of densities and forms. Each case contains data related to the research under exploration, such as FAR, uses, parcel coverage, number of residential units, average household sizes, employment densities, and building energy and transportation demand profiles. These cases were assembled using spreadsheets and GIS to generate development patterns. Assembled from sets of data-rich cases, the resulting patterns contain a range of information that can be analyzed in a variety of ways.
Phase 2—Generating Alternative Development Scenarios
Cases and/or development patterns were used to generate alternative development scenarios for each study site. This method involves assigning cases and/or patterns to all areas of the study site for a given scenario (baseline conditions or proposed future conditions). The research team implemented the method both in-house, and in design charrettes with stakeholders to generate alternative development scenarios. The design charrettes—intensively visual, collaborative events closely choreographed to productively engage diverse stakeholders in the processes of community design—provided the opportunity to consult with many in the exploration of alternative solutions. This process resulted in multiple scenarios for each study site, including one baseline and between one and three alternative scenarios for each.
Phase 3—Measurement of GHG Emissions
The development patterns were used as inputs to the two models that measured a scenario's GHG outputs: building—and transportation—energy use. The building energy model use profiles—quantitative descriptions of energy consumption by end use and energy source for each building type — to calculate energy demand in each scenario. Energy profiles were based on current demand, discounting future demand given a variety of assumptions, including changes in building technology, energy source and occupant behavior. The transportation demand model targeted the ability of the local government to mitigate resident-based emissions, and limited calculations to private-vehicle trips beginning or ending at a residential unit within the project area. The transportation model calculated energy demand as a product of the types of units (different unit types generate different numbers of trips per day), total trip length, vehicle efficiency, fuel assumptions, mode split, and proximity to major transit. The models were applied to each study site based on data availability, achieving the broadest findings with respect to range of GHG emission sources possible: the building energy model was applied to both Emerald Hills and North Vancouver scenarios; the transportation model was applied to the North Vancouver scenarios. An external consultant to the city measured the Calgary scenarios.
Findings
Analysis of modeling results indicates that it is possible to achieve the 33 percent GHG emission reduction target using a combination of urban form (density and land use mix), proximity to transit, and energy-efficient building technologies. The combination of urban form and either proximity to transit or moderate energy-efficient building technology strategies can achieve a 15 percent (moderate infill) to 31 percent (100 percent infill) reduction in relative GHG emissions. Using all three strategies can achieve a 50 percent reduction, provided there is a policy of 100 percent infill.
To achieve the 80 percent GHG emission reduction target requires a combination of urban form (100 percent infill plus land use mix), proximity to transit, intensive energy-efficient building technology strategies, plus a switch to a district energy system that uses low/no-GHG sources.
With a reasonable amount of on-site energy generation technologies (e.g. solar panels) in addition to the full complement of urban form, building efficiency, and district energy strategies, a 100 percent reduction in relative GHG emissions is possible.
The City of Calgary Compact Scenario achieved an anomalous 58% reduction in relative GHG emissions using urban form (100 percent infill and land use mix) and proximity to transit strategies alone. We hypothesize that this means the impact of reducing personal vehicle trips at a regional scale has a much greater impact than that achieved at the compact-city or neighborhood scale. Further study is required in this area.
Discussion
Professionals working with local governments on the planning and design of communities are increasingly being required to play a role in achieving GHG emissions reductions through urban form decisions, such as development density, land use mix, transit-oriented development and, for colleagues in architecture, energy-efficient buildings. This means professionals are increasingly required to know which design strategies and combinations of strategies will successfully achieve the targets set by state and provincial legislation, targets which can be higher than what has been shown to be achievable through urban form decisions alone.
This research illustrates that landscape architecture professionals can promote and implement urban form strategies alone to achieve a 31 percent reduction in relative GHG emissions and, with additional collaboration in the arena of energy efficient building design, to achieve a 50 percent reduction. Landscape architecture professionals can further contribute to achieving an 80 to 84 percent reduction by planning and designing communities to support implementation of district energy systems. To achieve greater reductions, however, will require complementary policy strategies in architecture, investment in appropriate technologies, and cooperation from all levels of governments to implement key components of strategies that are outside local government control.
Project Resources
Academic Affiliation
UBC Faculty of Applied Science
UBC School of Architecture and Landscape Architecture
Project Teams
Jone Belausteguigoitia, Elisa Campbell,
Duncan Cavens,
The City of Calgary Sustainable City Team, Patrick Condon, Kari Dow, Dave Flanders, Sara Fryer, Sigrid Gruenberger, Shana Johnstone, Ron Kellett, Courtney Miller, Nicole Miller, Susan Milley, Amanda Mitchell, Sara Muir-Owen, Inna Olchovski, Daniel Roehr, Jon Salter, Stephen Sheppard, Kristi Tatabe,
Jackie Teed
Consultants
Graham Barron, Graham Barron Design
Colin Cathcart, Kiss + Cathcart Architects
Jay Hiscox, Stantec
Wil Mayhew, Christenson Developments Ltd.
The Pembina Institute (consultant to City of Calgary)
Graham Smith, Sage Consulting
Lourette Swanepoel, The Sheltair Group
Joe Tkalcic, Atb Architecture
James Tuer, JWT Architecture and Planning
Eric Villagomez, Metis Design – Build
Funding Partners
British Columbia Ministry of Environment
Canada Mortgage and Housing Corporation (CMHC)
City of Calgary
Century Group
Christenson Developments Ltd.
Federation of Canadian Municipalities
Metro Vancouver
Natural Resources Canada
City of North Vancouver
Real Estate Foundation of British Columbia
Strathcona County, Alberta
The University of British Columbia
The community stakeholders who participated in the charrette processes.